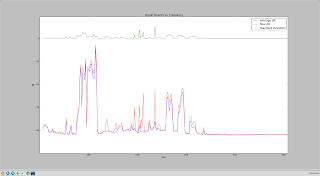
This weekend I finally had time to cook up some code that used the dongle to sweep across a given range of frequencies and record the strength of the signals received.
There are two parts to the tool. The first is the logger, which does the actual reading and storage of the data. The second is the plotter, which creates a graphical representation of the data points which have been stored. We will first start with the plotter.
redacted@awesomecomputer:~/sources/pyrtlsdr$ ./freqLogger.py -h
usage: freqLogger.py [-h] [-s START_FREQUENCY] [-e END_FREQUENCY]
[-g GAP_START] [-f GAP_END] [-i INCREMENT]
[-d DESCRIPTION] [-m MINUTES]
optional arguments:
-h, --help show this help message and exit
-s START_FREQUENCY, --start_frequency START_FREQUENCY
starting frequency for sweep
-e END_FREQUENCY, --end_frequency END_FREQUENCY
ending frequency for sweep
-g GAP_START, --gap_start GAP_START
start of band gap
-f GAP_END, --gap_end GAP_END
end of band gap
-i INCREMENT, --increment INCREMENT
frequency increment for loop
-d DESCRIPTION, --description DESCRIPTION
Description for report
-m MINUTES, --minutes MINUTES
Number of minutes to run scan
redacted@awesomecomputer:~/sources/pyrtlsdr$
If started with no options, the logger simply loops through those frequencies (in 1 MHz increments) which it can tune to, and logs the signal strength in the database. Please be aware that these values are based upon what my dongle can do, and they vary somewhat. The frequency ranges and band gap can all be set via command line arguments (or by simply editing the file, since it is written in Python). If I wanted to scan 162 through 174 MHz for 20 minutes I would simply run:
redacted@awesomecomputer:~/sources/pyrtlsdr$ ./freqLogger.py -s 162 -e 174 -m 20
Found Elonics E4000 tuner
The script would run for 20 minutes, then stop.
The plotter is quite easy to use as well. Its options are as follows:
redacted@awesomecomputer:~/sources/pyrtlsdr$ ./reportPlotter.py -h
usage: reportPlotter.py [-h] [-r REPORT_ID] [-l] [-t] [-m MIN_FREQ]
[-n MAX_FREQ] [-s SAVE]
optional arguments:
-h, --help show this help message and exit
-r REPORT_ID, --report_id REPORT_ID
report id to plot
-l, --list_reports list reports
-t, --time_plot plot signal strength vs time
-m MIN_FREQ, --min_freq MIN_FREQ
minimum frequency for graph
-n MAX_FREQ, --max_freq MAX_FREQ
maximum frequency for graph
-s SAVE, --save SAVE save graph to file (png)
Each run of the logger is listed as a report. To list the reports currently stored in the database, execute the plotter with the -l switch.
redacted@awesomecomputer:~/sources/pyrtlsdr$ ./reportPlotter.py -l
Report Id Minimum Frequency Maximum Frequency Increment Bandgap Minimum Bandgap Maximum Description
16 162.000000 174.000000 1.000000 1089.000000 1252.000000 Generic Report
15 406.000000 420.000000 1.000000 1089.000000 1252.000000 Generic Report
14 406.000000 420.000000 1.000000 1089.000000 1252.000000 Generic Report
13 406.000000 420.000000 1.000000 1089.000000 1252.000000 Generic Report
12 406.000000 420.000000 1.000000 1089.000000 1252.000000 Generic Report
11 406.000000 420.000000 1.000000 1089.000000 1252.000000 Generic Report
10 566.000000 574.000000 0.001000 1089.000000 1252.000000 Scan 566 to 774
1 52.000000 2176.000000 1.000000 1089.000000 1252.000000 initial scan
Two types of reports are supported, signal strength vs frequency, and signal strength vs time. Please be aware that strength vs time is probably only useful for a very narrow range of frequencies.
Signal Strength vs Frequency
Signal Strength vs Time
The code can be downloaded here.
In closing I must say that I actually do not know anything about digital signal processing at all. The method I use to read the signal strength is from a script found here. None the less, areas where high signal strength are reported correspond to known broadcasts, so I think this is correct information. This is also one of the first actually useful things I have ever done with Python, so it is highly likely that I have done some things that would be frowned upon by the Python community. Either way, I think I have put something useful together.


$ ./freqLogger.py -h
ReplyDeleteTraceback (most recent call last):
File "./freqLogger.py", line 20, in
except dbConnFail:
NameError: name 'dbConnFail' is not defined
Can you help?